Will Korea Stock Crash Spread to US?
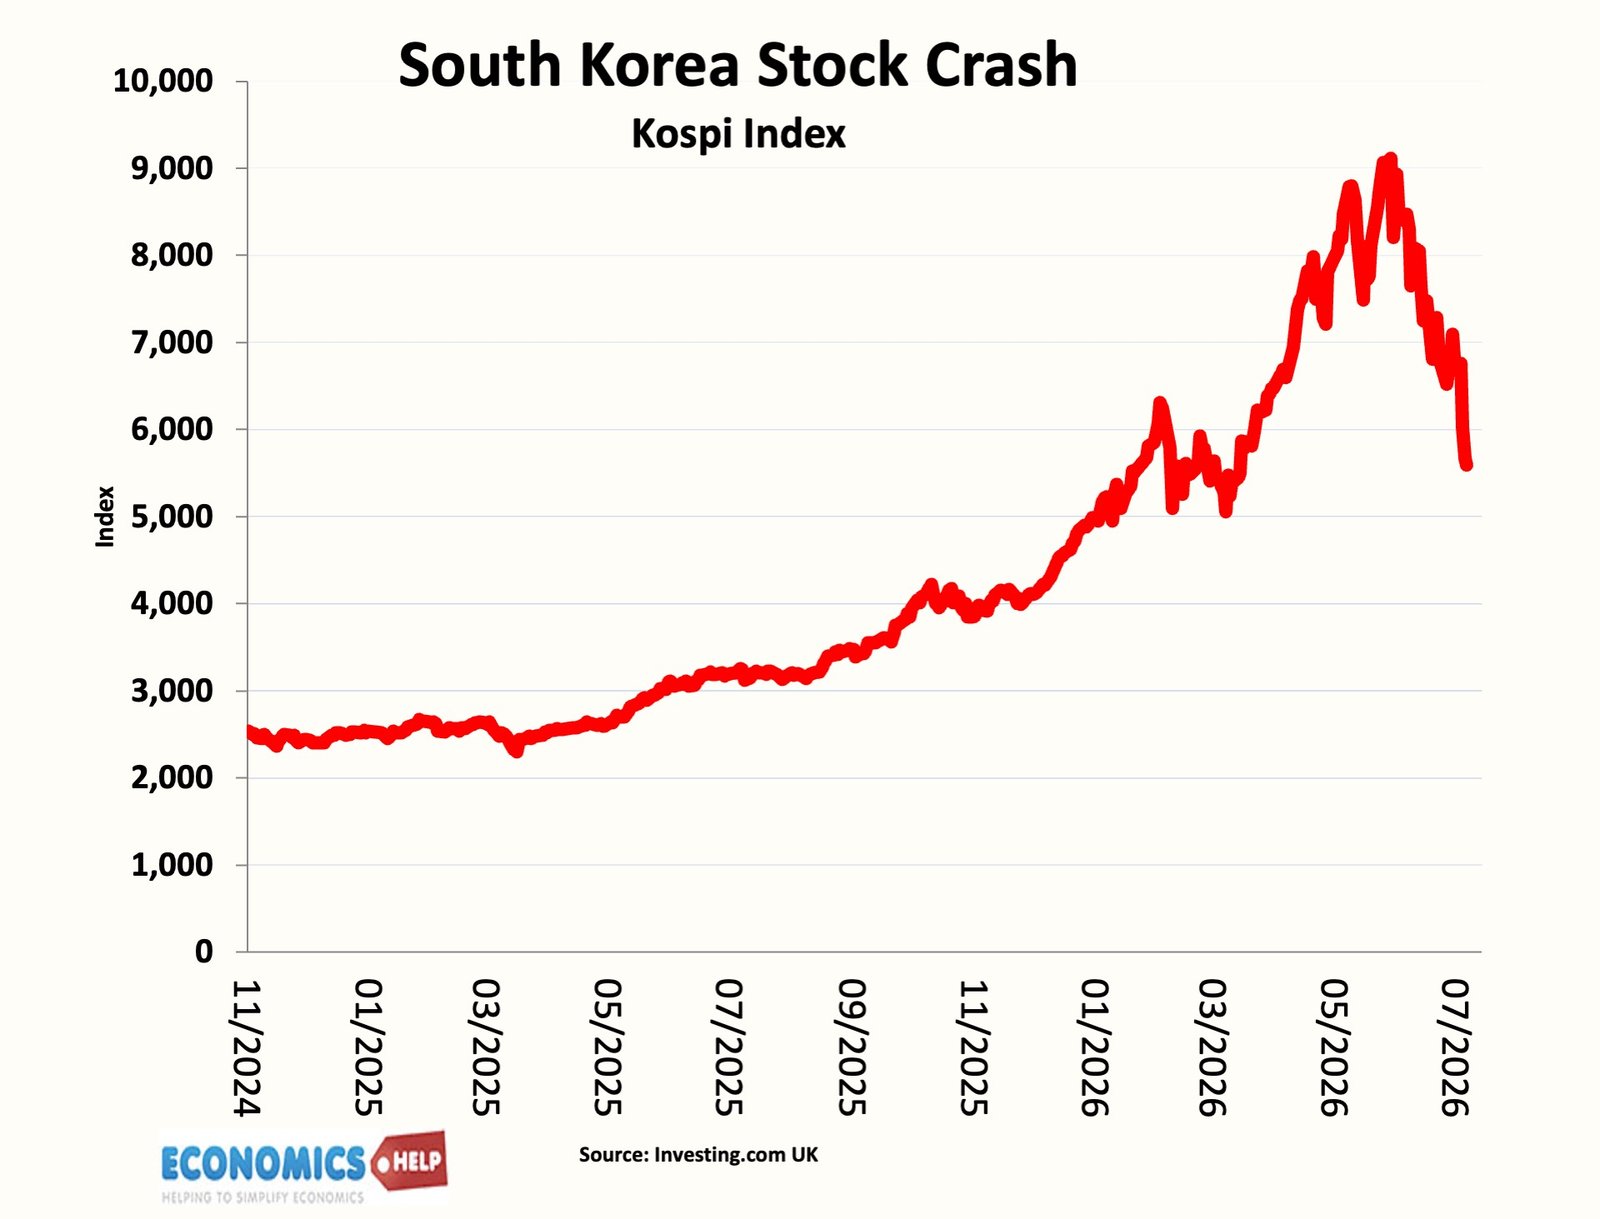
In June, South Korea had the best performing stock market in the world. But today it is seeing one of the fastest crashes in modern market history, dropping 34% in just 25 trading days and wiping $2.1 trillion off the Seoul market.

So the question for every investor – was this a uniquely Korean crash or a preview of what’s coming for Wall Street?

Because until this week, Wall Street was still enjoying the boom, the Dow near record levels. Yet could this be peak Dow? Because there are signs that the Korean crash is filtering through, with the S&P falling 1.5% and the Dow shedding 1,100 points this week.

Not only that, 30-year US bond yields have soared to the highest level since 2008, and in particular, concern over levels of AI investment has caused AI credit spreads to soar. There is a real sense of a sentiment shift.
Korea Boom and Bust
Now to understand the Korean crash, we need to acknowledge the boom. Korea makes the memory chips that the AI revolution needs – Samsung and SK Hynix. As AI investment exploded, so did demand for memory chips. Samsung’s chip division will make more profits in 2026 than it did in the past 40 years combined. But as stocks soared and people talked up the market, there was a very familiar story of investors using leveraged ETFs to pile into the boom – it was the old fear of missing out, pushing stocks parabolic.

What started the crash was fairly innocuous – the news China had begun mass production of its own chipmaking tools.

But as stocks fell, leveraged ETFs are forced to sell to rebalance – the selling isn’t a choice, it’s built into the product. This creates a feedback loop that pushes prices lower. The spectacular boom turned to bust.
What relevance does this have for Wall Street? Well, Korean chips are an important supply chain for the AI boom, so the crash in Seoul hit US chip stocks straight away.

The AI boom has both lifted Wall Street and provided a large share of US economic growth. But the boom in the US stock market has been very narrow. Since 30 March, roughly 69% of the S&P 500’s gains came from just 10 stocks, like Nvidia, Google and Amazon.

The boom in share prices has pushed the Shiller S&P CAPE ratio to 39.9, not too far below the historic highs of 1999.
Now, the Korean crash definitely crystallised uncertainties about the future of AI. The problem is that Wall Street has already priced in very ambitious future revenue growth. But there is a growing realisation that it’s going to be harder to make profit.

Firstly, cheaper Chinese open source models have taken market share from US firms like OpenAI and Anthropic. Secondly, there is a backlash against building data centres. Thirdly, companies are more careful about spending on tokens. Fourthly, whilst Nvidia is making extraordinary profits, there is a circularity behind AI spending. Nvidia is funding the revenues of its own customers, who then promise to buy Nvidia’s chips. But perhaps the most important change is that until very recently, big tech was enormously profitable and had large cash flows. It was funding the investment from cash. Now investment is outstripping cash flows, so it is funded by borrowing – and perhaps the biggest warning sign for a potential crash is the amount of debt held off balance sheets. This matters because it hides the extent of debt-funded investment.
But the thing that really matters is that credit spreads of AI firms are rising. This means there is a growing awareness of risk, and firms need to pay higher interest to fund investment. And as interest rates rise, it makes all investment relatively less profitable.

Now, another factor is the rise in US bond yields. Post 2008, interest rates were close to zero, and bonds gave a very poor return. With quantitative easing, there was a huge rise in the money supply, and this found its way into the stock market. The stock market simply gave a better return than holding bonds.

But that is changing. 30-year US bond yields have reached 5.2%. So for an investor seeking income, the bond market is giving better returns, without the risks of equity. Now, this doesn’t mean on its own stocks will crash, but it does mean shares are relatively less attractive than in the post-2008 boom.
Global Shocks
The third warning sign is that whilst the stock market reached record levels, the global economy faces real shocks. The Iran War has disrupted oil supplies, and whilst crude oil prices are lower than perhaps expected, there are real shortages in the refining of diesel. Oil shocks have historically coincided with global recessions, but at the very least global inflation is expected to rise, and interest rates will stay higher than otherwise. And with US deficits reaching record peacetime levels, debt interest payments are going up.

This shows the amount of US debt maturing in one year – it means the government needs to keep selling more bonds. So there is the problem: if the Fed raise interest rates, it will slow growth and give the government a fiscal headache, but if they don’t raise rates, they fear consumer inflation will continue to rise. The Fed don’t really want to raise rates, but markets are doing it for them. This is a big problem for firms borrowing to invest.
Bull Case

If you wanted to present a bull case and explain why the stock market has risen, then the rise in corporate profit would be the first case for the defence. US corporate profit has risen in both absolute levels and as a share of GDP. However, that has led to an unbalanced US economy, with the household sector weak – the recent rise in inflation caused a fall in real wages. If you look at underlying metrics for the economy away from AI, there are warning signs like slow employment growth and weak consumer spending.

When employment as a share of population falls, historically this has coincided with recession.

Now, it is worth saying that at least on some metrics, things are not quite 2001. For example, if you look at the current price to earnings ratio for the tech sector, it is currently 32.9 – high, but by no means close to the bubble levels we saw in 2000.
But the problem is not current revenues – it is the future ambitions of AI. With the current planned level of investment, the Economist notes it would require AI revenue of $2.5 trillion a year. That would mean 33% of all firms in OECD countries spending $100,000 on AI. Is that plausible? 2026 has not seen exponential growth in AI spending – in fact, firms are becoming more careful.
So what’s the verdict? Well, two ironies. Firstly, the UK FTSE-100 reached record levels this week because it is seen as an anti-tech index – it is dominated by companies away from AI. You can see the FTSE-100 and European shares have definitely fallen behind the US stock market in the past decade, but that difference largely reflects tech pushing up US stocks. Secondly, the South Korean crash needs to be seen in context – despite a 34% fall, it is still 40% up in dollar terms on the start of the year. Yet J.P. Morgan assigns a 35% probability to a scenario where a slowdown in AI spending triggers a global downturn. So there are very real concerns. AI technology does have real benefits, but it doesn’t necessarily mean firms will make as much profit from it as they ambitiously forecast. And beyond AI, there is a sea-change in the investing landscape, with a really significant rise in long-term US bond yields. In fact, the interesting question is how sustainable is US debt – this video explains what may happen next.
Sources
About The Author