
If your salary is anything above £39,039 a year, that places you in the top half of all full-time workers in Britain. In fact, a new Statesman survey states 60% of Britons earning £90,000 think they are about average. But just £100,000 a year would place you in the top 5% of all salaries. Of course, there is more to living standards than just income – wealth, housing costs and living expenses are all important – but whatever your salary, the uncomfortable part is that you’ve seen very little growth in the past 16 years, with average salaries stagnating in recent years.
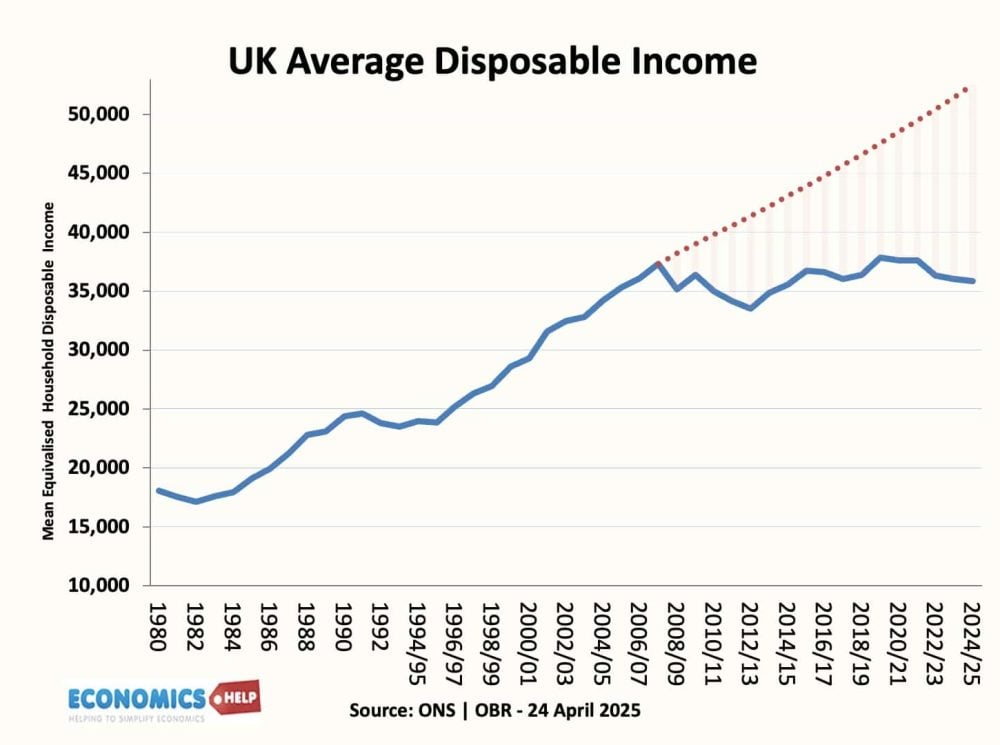
This is backed up by the annualised growth of disposable income by parliament. Until 2007, it averaged above 2%, but in the last six years it fell for the first time since the Great Depression. But let’s dive deeper into what people earn, with some surprising statistics on how much we earn, pay in tax and hold in wealth.

Firstly, the figure of £39,039 shows average full-time pay, but not everyone works full time. If you include part-time work, the median pay is £32,890. This is not because part-time workers necessarily get lower hourly pay, but because they work fewer hours. Sometimes this is a matter of choice, but it could also be people on zero-hours contracts, who end up with fewer hours than they would like. In fact, UK under-employment has risen to the highest level since 2013, with 3.7 million wanting more hours.

A minimum wage of £12.71 means if you work 40 hours, you will be getting £26,436 a year (£2,200 a month), which is roughly two-thirds of the median wage. But, and this is a big caveat, with growing wage costs, firms are trying to cut hours, especially in places like hospitality. An increase in the minimum wage doesn’t help if you get fewer hours.

Now, looking at regional pay, there is an obvious difference in terms of region. The median annual pay is unsurprisingly highest in London. To me, a slight surprise was Scotland’s median pay being above the UK average; the North East was the lowest at £29,584.

If we look at house prices, there is almost a mirror image, with London the most expensive and the North East one of the cheapest. By the way, you might be thinking, “I expected London pay to be even higher than £39,000.” The reason is that in London you see the biggest wage inequality. The median is the salary of someone in the middle of the income distribution.

But if you look at the mean average, this gives a much bigger weighting to the top city salaries, and this gives London wages an average of £4,635, pulled higher by the big salaries you get in the City. And interestingly, this relates to the net fiscal balance of the UK by region. London is the big contributor to the UK Treasury, with most regions being net recipients. And this regional gap has grown in recent years: London’s contribution has increased, and other regions have become bigger net recipients. Anyone remember levelling up? It didn’t work.
Top 1%

Now, what salary would you need to be in the top 1% of full-time earners? Well, the answer is £186,840. Again, that might seem low – we are used to hearing about Premier League footballers receiving this kind of salary per week. There are quite a few footballers on more than £250,000 a week. In fact, the best-paid footballer received a base salary of £27.3 million plus bonuses. By the way, did you know Erling Haaland was born in Leeds when his father was playing for Leeds United?

Anyway, so far we have just been looking at gross salaries, but of course, we know that what matters is what you get to take home after paying tax. For a median salary of £39,039, you will pay income tax of £5,294 and National Insurance of £2,118, leaving a take-home pay of £31,627.
But the amount of income tax you pay is highly variable because of the nature of the tax system and tax thresholds. If you are on a minimum wage-related salary, you get to keep 87% of your salary, paying only £3,200 in tax. But for the top 1%, you keep only 59% and pay £76,000 in tax. And by the way, remember Erling Haaland on a base salary of £27 million and an estimated £45 million with bonuses. In theory, he would pay £20.2 million of income tax and get to keep 53% of the total. That is enough income tax for 524 median workers. Manchester City would also have to pay employer NI of roughly £6.8 million on top. Of course, in the real world, this is why they try to avoid paying tax, with bonuses paid as image rights rather than PAYE income. But the higher your pay, the higher the average rate of income tax. For an income of around £12,000 you pay 0%, at £25,000 it is 10%, and over £200,000 you approach 40%.
The IFS states that the top 1% of income tax payers received 13% of taxpayers’ pre-tax income and paid 29% of all income tax revenue. The bottom 50% of income tax payers paid less than 10% of income tax, though it is worth bearing in mind that other taxes, like VAT, NI and council tax, are less progressive.
Graduates

What about graduates? Graduate starting salaries sit at around £28,000, less than the median average wage, but there is a big discrepancy depending on the type of job. Lawyers start on over £47,000. Finance sits between £33,000 and £52,000, whilst creative arts and media is a less-than-minimum-wage kind of job.

The graduate earnings premium has declined in recent years as student numbers have risen, meaning that 20–25% of graduates may fail to get back the cost of studying. Whilst graduates’ earnings have stagnated, with student loans rising and income tax thresholds frozen, the amount of tax and loan repayments paid is expected to increase over the rest of the parliament. For a graduate earning 50% above the median, the expected repayment will rise from £10,000 in 2020 to £20,000 in 2030.
Obviously, the pay you get varies by age; a graduate starting salary is not a good guide to what you might get in 10 years. Generally, take-home pay rises until your late 40s, but as people get towards 60, early retirement tends to lead to lower median pay.

The actual salary people get does tend to peak in the late 40s. Interestingly, managers and directors command the highest pay in their 40s, but after that, firms are less willing to pay older managers. But for healthcare professionals, the older you are, the more you earn. Sales roles have a similar age-related wage profile to managers, but much lower wages.

The final thing is that pay is one source of income, but this also ignores government welfare payments. Welfare payments total around £333bn, of which the biggest section is the state pension, and then universal credit and disability allowances, and these figures are set to rise in the coming years. A full state pension is worth around £12,000 a year. There are no actual figures for average incomes received from benefits because they vary so widely. Basic unemployment benefit starts at around £12,000; in theory, incapacity and PIP payments could increase take-home income to £24,000, but these figures are highly conditional on different levels of support.
The final thing is: what about average wealth? The ONS states median wealth in the UK was £293,700. There is, of course, a big age disparity, as wealth accumulates over time, especially in housing and pensions.
Is the UK better off than the US? We frequently hear UK incomes are lower than Mississippi’s. This is somewhat misleading, as dollar conversions fail to take into account purchasing power parity and other living costs.
About The Author
