
Crude Oil buys its fourth peace of the year while the tankers stay parked
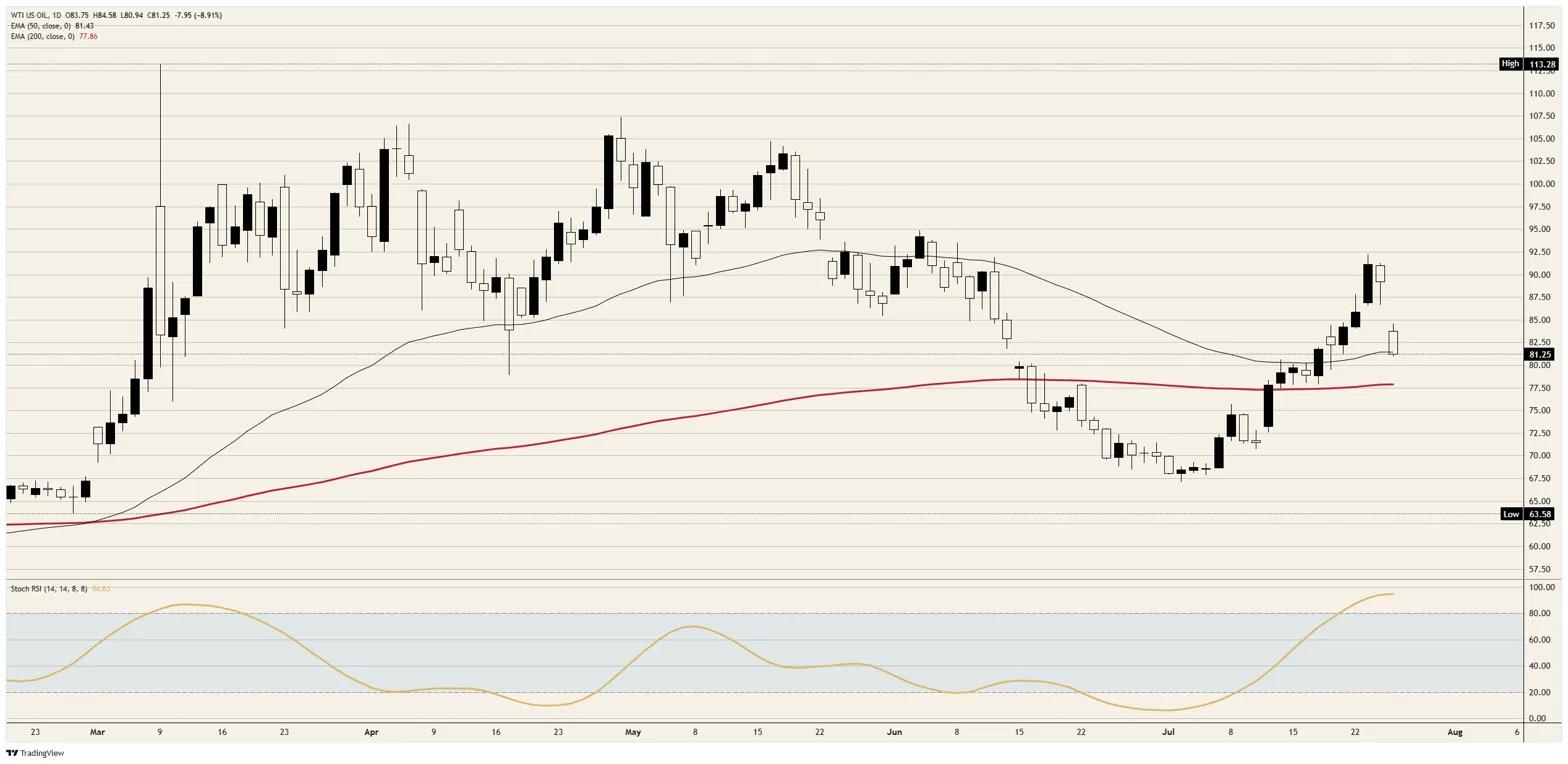
WTI Crude Oil trades just above $81.00 on Monday, down close to 9% from Friday’s close near $89.00, having gapped more than $5.00 lower at the open and spent the session extending rather than repairing it. Brent broke beneath the $90.00 handle for its steepest single session since the April ceasefire. What the market has bought is the fourth de-escalation of this war since the spring, and this one has no signature on it at all.
A ceasefire with one participant
Washington suspended its strike campaign over the weekend after 13 consecutive nights, and by Monday a third day had passed without attacks. The American president told reporters he had plenty of time for talks, saw a good chance of a deal, and would resume operations with greater force if negotiations failed. He also said the pause came at Tehran’s request.
Tehran’s foreign ministry spent the same day saying there are currently no negotiations with the United States, and that its only live channel is with Oman on the future of the Strait. The two countries’ deputy foreign ministers did meet in Tehran over the weekend to discuss safe passage, and Iranian officials describe progress. They also confirmed that the status of maritime traffic through the Strait has not changed. Mediators led by Qatar and Pakistan are reported to be working toward restoring the collapsed interim framework, which is a description of an ambition rather than a deal.
A pause with a supply chain
The reason for the stand-down matters more than the fact of it. Reporting attributes the American decision in part to advisers warning that the campaign was running short of viable targets and drawing down munitions faster than was comfortable, a characterisation the president has publicly dismissed. Iran, for its part, has signalled it will hold fire for as long as Washington does, without confirming that anything is being negotiated.
A pause sourced to magazine depth is an inventory problem wearing the clothes of an agreement. It ends when the inventory is replenished or when either side decides the other has stopped paying attention, and neither of those conditions is priced into a market that has just repriced nearly a tenth of its value in a session. April, May and July each produced a version of this trade, and each time the reversal arrived faster than the rally that preceded it.
The physical market did not participate
Nothing that actually constrains supply moved on Monday. Fewer than 10 commodity vessels a day transited the Strait of Hormuz across the weekend, a waterway that normally carries around a fifth of global supply flows. Bab al-Mandeb remains effectively blocked by Yemen’s Houthis, who kept claiming attacks on Saudi targets through the weekend, which pushes roughly 5 million barrels a day of Saudi cargoes onto the longer and more expensive route around Suez.
The retail evidence points the same way. The American average pump price reached $4.11 a gallon over the weekend, about 11 cents higher on the week and roughly 38% above where it stood when the war began in late February. Paper Crude Oil has taken its peace dividend. Physical Crude Oil has not been offered one, and until vessel counts recover the discount being applied to the front of the curve is a bet on diplomacy rather than a reflection of barrels.
The week ahead
The macro calendar gives the market a second thing to trade. The Federal Reserve decides Wednesday at 18:00 GMT, with consensus expecting a fourth consecutive hold at 3.75%, no Summary of Economic Projections attached and a live minority priced for a hike. Cheaper energy is the one clean disinflationary input the committee has received all summer, which makes the chair’s treatment of it the most instructive part of the press conference half an hour later.
Thursday at 12:30 GMT brings second-quarter growth seen at 2.1%, core Personal Consumption Expenditures at 0.2% MoM and 3.3% YoY, and jobless claims expected to rebound to 204K from an unusually low 187K. Friday adds the Employment Cost Index at 0.8%, Chicago activity at 56 and the University of Michigan inflation expectation series, alongside both Chinese official Purchasing Managers Index readings, each seen landing exactly on the 50 line. The demand side of this market has been the forgotten half of the story all year, and a week of soft American growth prints would give the sellers something more durable than a rumour.
Crude Oil levels
Resistance: The session high near $84.50 caps the immediate rebound, and above that the shelf near $90.00 marks where last week’s war premium was still intact.
Support: The $80.00 handle is the first line beneath spot, with the rising 200-day Exponential Moving Average (EMA) near $78.00 the level that has underpinned every flush since the spring.
Bias: Bullish against $78.00. The daily Stochastic Relative Strength Index reading above 94 is a lagging artifact rather than a signal, and a market that has sold a supply disruption nobody has repaired is a market to buy on weakness, with the view wrong on a daily close beneath the 200-day EMA.
WTI daily chart
WTI Oil FAQs
WTI Oil is a type of Crude Oil sold on international markets. The WTI stands for West Texas Intermediate, one of three major types including Brent and Dubai Crude. WTI is also referred to as “light” and “sweet” because of its relatively low gravity and sulfur content respectively. It is considered a high quality Oil that is easily refined. It is sourced in the United States and distributed via the Cushing hub, which is considered “The Pipeline Crossroads of the World”. It is a benchmark for the Oil market and WTI price is frequently quoted in the media.
Like all assets, supply and demand are the key drivers of WTI Oil price. As such, global growth can be a driver of increased demand and vice versa for weak global growth. Political instability, wars, and sanctions can disrupt supply and impact prices. The decisions of OPEC, a group of major Oil-producing countries, is another key driver of price. The value of the US Dollar influences the price of WTI Crude Oil, since Oil is predominantly traded in US Dollars, thus a weaker US Dollar can make Oil more affordable and vice versa.
The weekly Oil inventory reports published by the American Petroleum Institute (API) and the Energy Information Agency (EIA) impact the price of WTI Oil. Changes in inventories reflect fluctuating supply and demand. If the data shows a drop in inventories it can indicate increased demand, pushing up Oil price. Higher inventories can reflect increased supply, pushing down prices. API’s report is published every Tuesday and EIA’s the day after. Their results are usually similar, falling within 1% of each other 75% of the time. The EIA data is considered more reliable, since it is a government agency.
OPEC (Organization of the Petroleum Exporting Countries) is a group of 12 Oil-producing nations who collectively decide production quotas for member countries at twice-yearly meetings. Their decisions often impact WTI Oil prices. When OPEC decides to lower quotas, it can tighten supply, pushing up Oil prices. When OPEC increases production, it has the opposite effect. OPEC+ refers to an expanded group that includes ten extra non-OPEC members, the most notable of which is Russia.