AST SpaceMobile vs. Vertiv: Comparing Revenue Scale and Consistency
AST SpaceMobile (ASTS -2.75%) vs. Vertiv Holdings (VRT +2.97%) are high-growth companies offering significant returns for patient investors. These stocks are promising ways to invest in the rapidly expanding space economy, particularly satellite broadband services, and data centers optimized for artificial intelligence (AI).
These companies are at two different stages of their growth. AST has the look of an early-stage growth company, while Vertiv is a more established provider of power management solutions. Investors will have to decide between paying an expensive valuation for AST SpaceMobile’s promise of higher revenue down the road and paying a more reasonable price for Vertiv’s consistent revenue performance.
Ast SpaceMobile: Early Revenue Volatility
AST SpaceMobile establishes and operates a satellite-based cellular broadband network that connects directly to standard mobile phones, delivering mobile internet access to individuals in remote or unserved locations worldwide.
In July 2026, it completed an upsized $1.15 billion private offering of convertible senior notes and revised its satellite deployment schedule, while reporting about -1,296% net income margin for the quarter ended March 31, 2026.
ASTS & VRT: Performance Comparison
Key Financial Metrics

ASTS – AST SpaceMobile
$68.38
–2.75% (–$1.93)

VRT – Vertiv
$277.94
+2.97% (+$8.01)
Market Cap
$21B
52wk Range
$36.08 – $133.86
Gross Margin
-22429.27%
P/E Ratio
-39.53
EPS (TTM)
$-1.78
Dividend & Yield
N/A
Market Cap
$104B
52wk Range
$118.70 – $379.94
Gross Margin
35.73%
P/E Ratio
61.08
EPS (TTM)
$4.42
Dividend & Yield
$0.23 (0.08%)
ASTS – AST SpaceMobile
$68.38
–2.75% (–$1.93)
Market Cap
$21B
52wk Range
$36.08 – $133.86
Gross Margin
-22429.27%
P/E Ratio
-39.53
EPS (TTM)
$-1.78
Dividend & Yield
N/A
VRT – Vertiv
$277.94
+2.97% (+$8.01)
Market Cap
$104B
52wk Range
$118.70 – $379.94
Gross Margin
35.73%
P/E Ratio
61.08
EPS (TTM)
$4.42
Dividend & Yield
$0.23 (0.08%)
Vertiv: Consistent Revenue Expansion
Vertiv specializes in the design, manufacturing, and servicing of critical systems and lifecycle services vital for data centers, communication networks, and diverse industrial applications worldwide.
During the recent period, it acquired thermal engineering firms ThermoKey and Strategic Thermal Labs, while generating about 15% net income margin for the quarter ended June 30, 2026.
Why Revenue Matters for Retail Investors
Revenue is the most fundamental measure of a company’s performance. Changes in revenue over several years can reveal a lot about a company’s competitive position in its industry and how easy (or difficult) it is to expand and reach new customers.
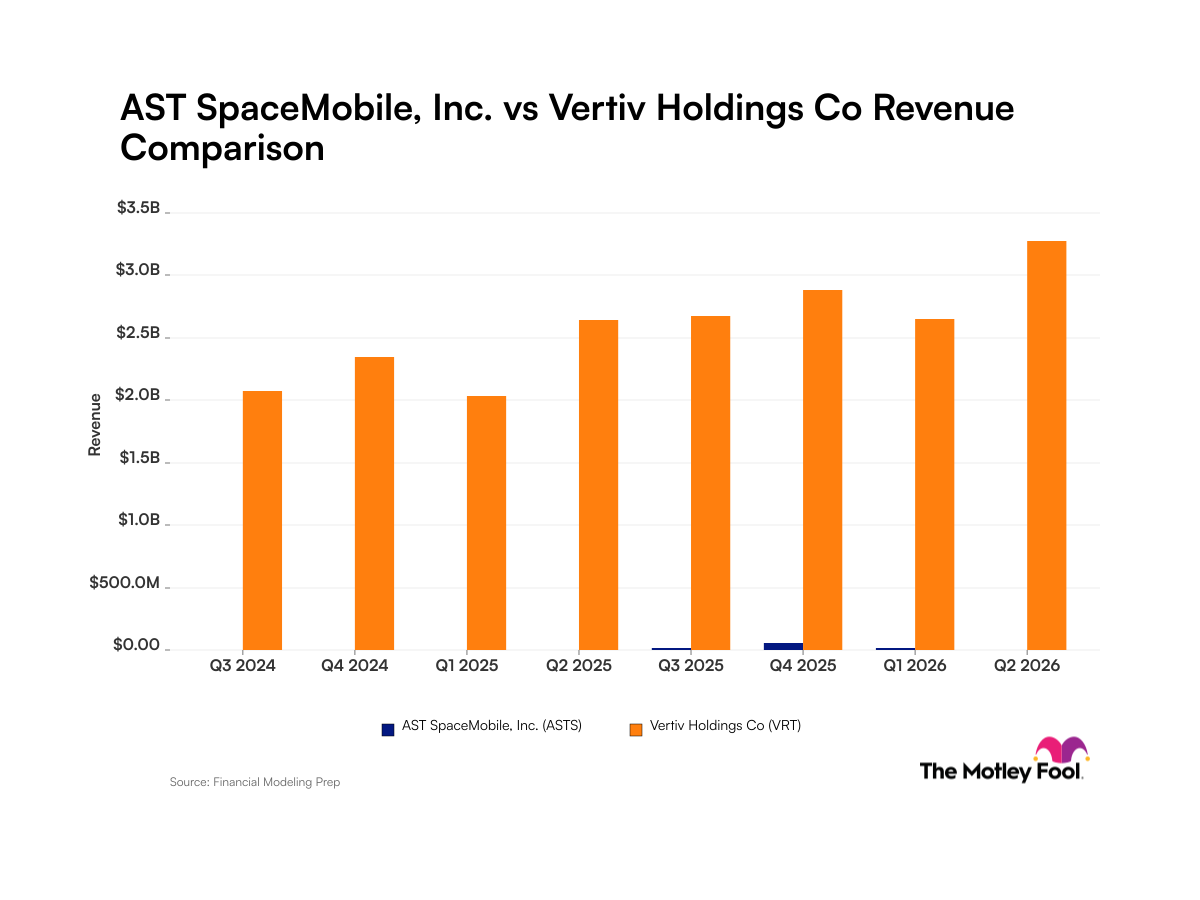
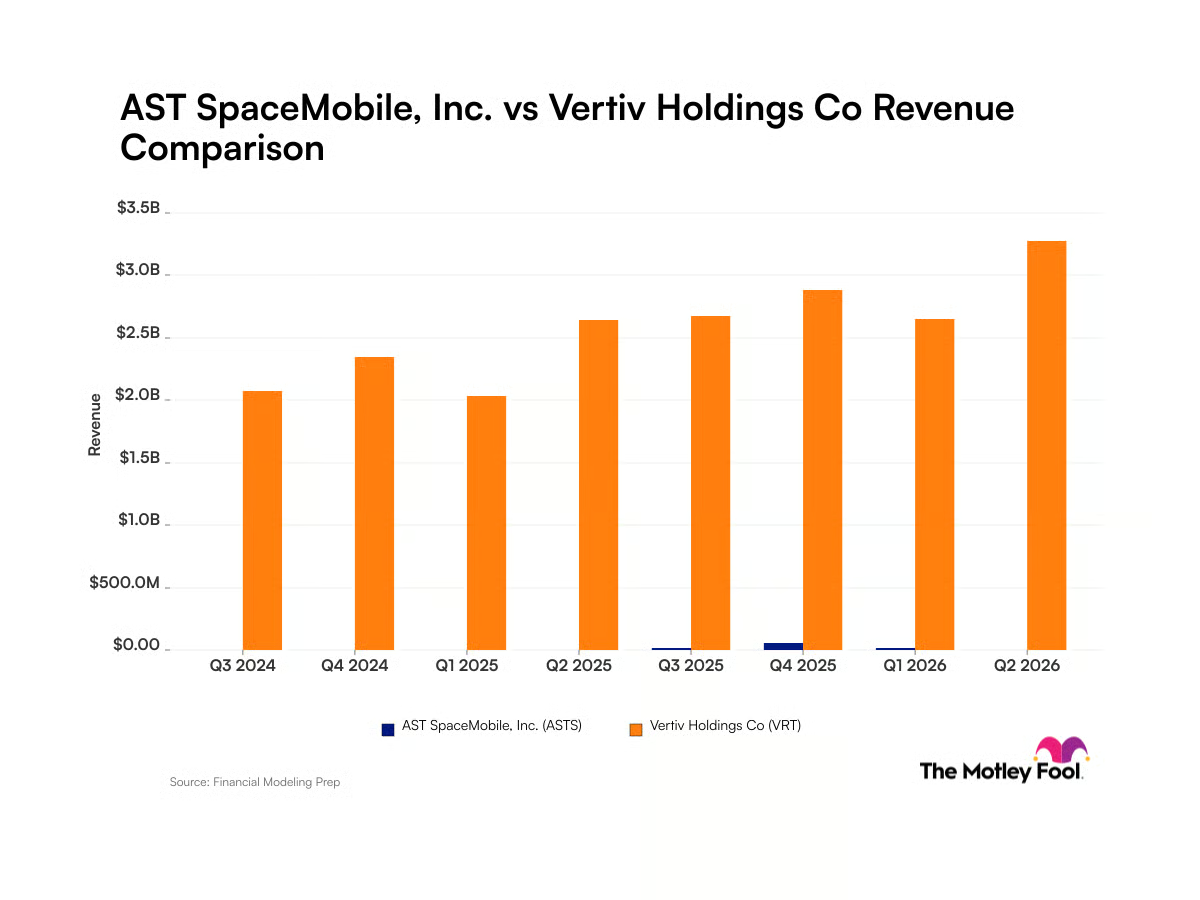
Quarterly Revenue for Ast SpaceMobile and Vertiv
| Quarter (Period End) | AST SpaceMobile Revenue | Vertiv Revenue |
|---|---|---|
| Q3 2024 (Sept. 2024) | $1.1 million | $2.1 billion |
| Q4 2024 (Dec. 2024) | $1.9 million | $2.3 billion |
| Q1 2025 (March 2025) | $718,000 | $2.0 billion |
| Q2 2025 (June 2025) | $1.2 million | $2.6 billion |
| Q3 2025 (Sept. 2025) | $14.7 million | $2.7 billion |
| Q4 2025 (Dec. 2025) | $54.3 million | $2.9 billion |
| Q1 2026 (March 2026) | $14.7 million | $2.6 billion |
| Q2 2026 | Not yet reported | $3.3 billion (period ended June 2026) |
Data source: Company filings. Data as of July 30, 2026.
Foolish Take
AST SpaceMobile stock is richly valued, trading at 225 times its trailing 12-month revenue, while Vertiv Holdings is a larger, more established growth company trading at roughly 9 times revenue. For AST to justify its higher valuation, it will have to continue expanding rapidly.
AST has spent the last several years laying the groundwork for its global cellular broadband network. It has invested heavily in research and development (R&D), but is just now beginning to convert those investments into a fast-growing revenue stream. It is scheduled to launch its BlueBird satellites 8, 9, and 10 on Aug. 5. Analysts expect revenue to increase from $71 million in 2025 to over $1.8 billion by 2028.
Meanwhile, Vertiv is delivering steady 20%+ quarterly revenue growth, with solid margins. It is meeting the need for more efficient power management solutions for data centers. It’s investing in new power technologies to handle the complexities of AI computing systems, along with strategic acquisitions, to expand. Analysts expect the company to continue growing at a steady rate, with revenue rising from $10.3 billion in 2025 to nearly $22 billion by 2028.
Investors are paying a big premium for AST, with the shares currently trading at a high forward price-to-sales (P/S) multiple of roughly 13.6x on 2028 estimates. Vertiv is trading at a lower 4.7x forward P/S multiple.
AST’s high valuation also carries risks. Satellite broadband is a huge opportunity that is attracting competition from Amazon’s Leo and Kuiper. Execution in launch cadence, satellite deployment, and beating competitors to deliver quality global broadband service is imperative to justifying AST’s valuation.
Vertiv also faces risk from dependence on hyperscalers’ aggressive capital spending for data center infrastructure. Any slowdown would pressure Vertiv’s growth. If AST can overcome risks and narrow the gap in its annual revenue relative to Vertiv, that could translate into big returns for patient investors. The decision to invest in either of these stocks is fundamentally a question of which company has an easier path to maintaining growth.